There is yet another possibility to display movements graphically:
Time-velocity-diagram.
It shows the velocity of a body at a certain point of time. If you are moving at a constant velocity, the chart will show a straight line:
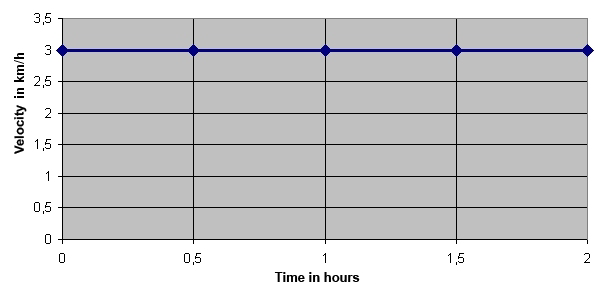
Now you are moving at a speed of 3km per hour.
You can also read off the distance you have covered from the chart.
The covered distance is always represented by the area below the straight line:

If you want to know how far you can go during one hour, you can read the value from the X-axis: 1 h. You multiply this value by the value from the Y-axis: 3 Km/h * 1h = 3 km Consequently you have covered a distance of 3 kilometres during one hour.