How do I draw a distance-time-diagram:
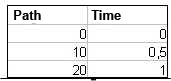
If you want to display a movement graphically, you first need the values for distance and time. You can see them in a table of values or you think about the distance the body has covered at a certain point of time. In order to draw the graph you need at least two value pairs. Then you can transform them to a coordinate system. The Y-axis represents the distance and the X-axis represents the time.
Example: Uniform movement at 20 km/h:
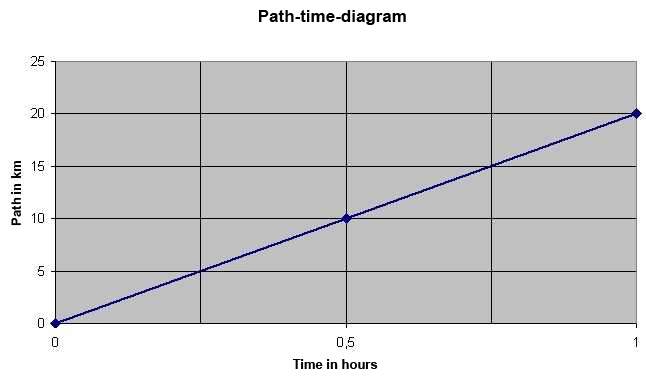
In this graph you can read the distance from the vertical axis (Y-axis) now, which was covered during a certain period of time (horizontal axis).